I decided to share what I’ve learned doing this stuff with Dynamo. The purpose of this is related to Construction engineering, and it was a bit discussed in this RFO thread.
see at the end of this post the videos to see how it works in the project, or go here.
This post will detail the complete workflow I’ve used to generate this, because I think it could be applied to many purposes as a generic tool. It is all about sharing knowledge to push AEC industry further and higher. Let’s start
(Warning: long post, kittens may be wounded hehehe).
The data needs to be collected in the Revit document: position of the crane, of the beams, weight of the beams; but also from outside Revit, in a spreadsheet existing as an Excel document.
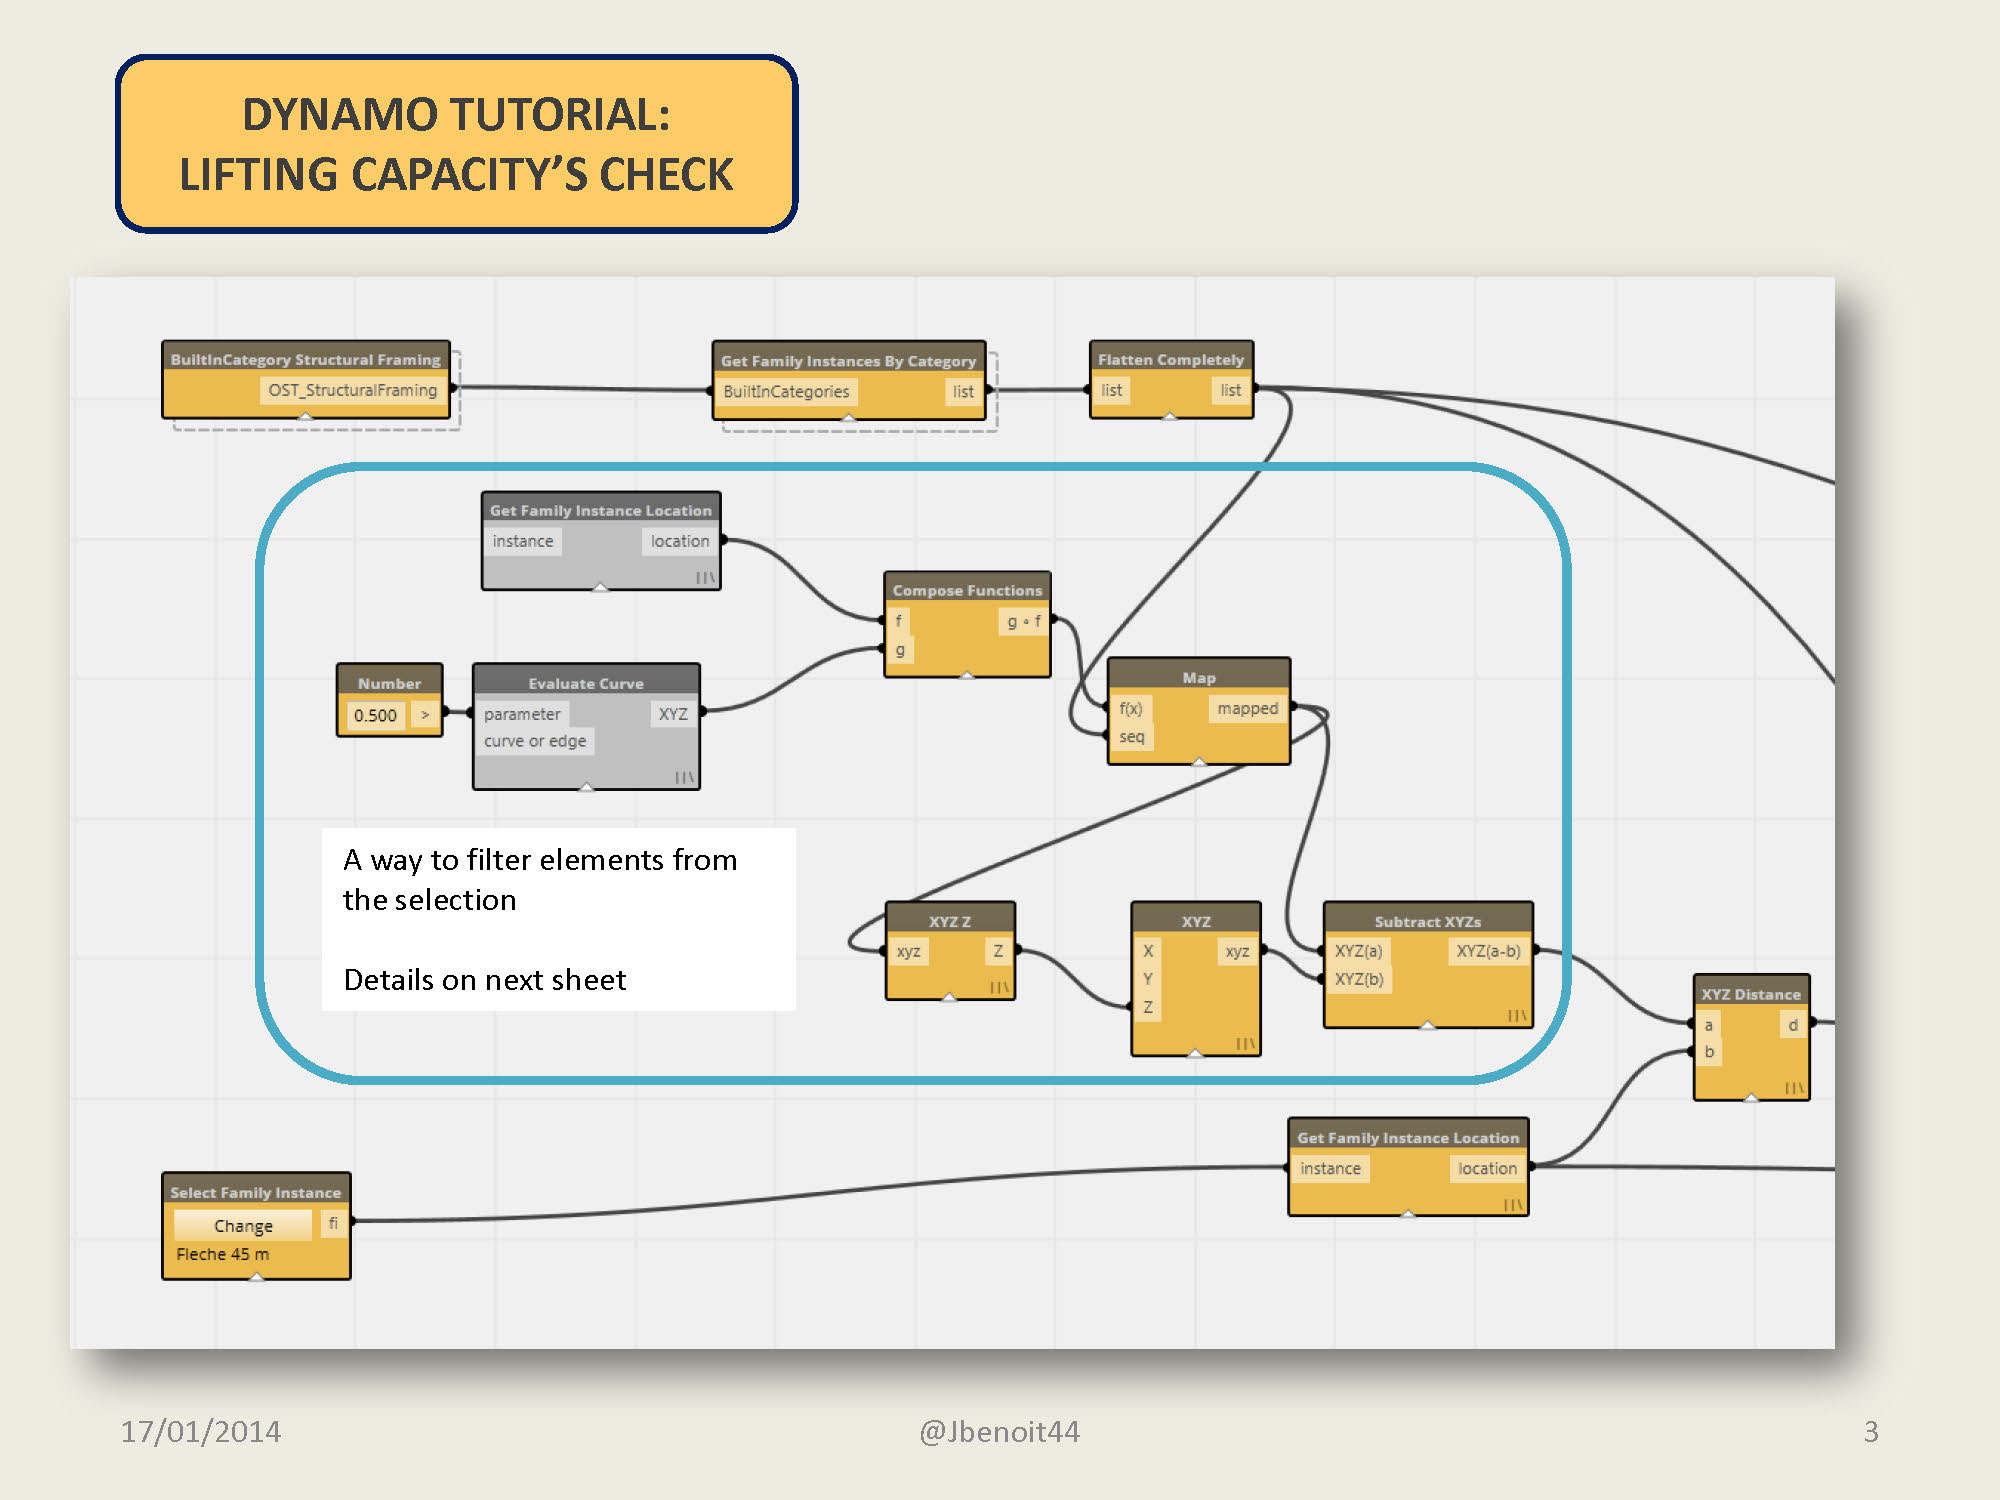
Once this is OK, I need to check if the beams are in the crane operation area, I will do this by checking the max value of the ranges column in excel regarding this particular tower crane; then I have to filter element that are inside this area with a filter out node collection.
Frankly, it was one the most tricky part, as it is some nesting capabilities of nodes in Dynamo.
I also have to evaluate the projected length between beam and crane, not really the distance between the 2 points.
Now the information about the beams will be compared to the max range value for this crane. If distance from beam center to crane is greater, those will be filtered out.
The filter out function is a real need, Andreas Dieckmann was kind enough to share this package, Filter list by booleans. A must have.
At first try, I didn’t set any reset nodes for elements outside the range, but it is absolutly necessary. It is very simple, by just applying a blank value to a parameter to appropriate elements.
Now that we have collected elements, let’s evaluate the distance on the XY plane between beams and crane. tricky part again here, as Get family location applied to beams returns a curve, a line in fact. To get the center of the line, evaluate curve node is here, with parameter set to 0.5 (0 is the start, 1 is the end).
The next slide shows the calculation of the beams weights, with the factor to apply to convert units (weird thing here as the factor is not the one you would expect for just the unit conversion, a bug or something). Reinforced Concrete density is set to 2.4, but can be tuned. Let’s have a look at the input coming from the Excel spreadsheet. You select the appropriate sheet by is name, then read the data. I don’t want the first row, so I put a rest of list node.
You get values in a row by row list, the function to transform 10 pairs of 2 values into 2 lists of 10 values is the Tranpose node.
Then you have 2 lists: one for the money, two for the show… 🙂
The ranges list has a indication we need: the max range of this crane type. I use there a List maximum node. It is used above to get the element in the range.
The next slide is about the final operations applied to the data we have collected. This is called a custom node, as it is made by user. Basically, it is a nested definition, that allows among other thing to make a loop applied to lists of data; Now we are looking at what’s inside the custom node. To apply the loop, the CN is present here, meaning that when the first values have been calculated, the next ones will be as well. As it is a loop, it must have an end, otherwise infinite loop is created, with crash resulting. To avoid this, CN contains a check on the data’s list, that stops the loop once all values were passed.
The first operation is simple: it compares the available ranges to consider in the crane datas. If the beam is at 42 m, borders in the ranges list are 38 and 45 m. 38 value index in the list gets a 1 value, 45 gets a 0. next slide: filter all the values that gets a 1 (available ranges to consider). Here I use kind of a trick as using the list length to get a number, number I use then as an index to get a data in the list of load capacities. If beam is at 42 m, the max load is the one available at 45 m, so I will compare the weight to the capacity of the crane at this distance. This is done in the slide below. A test node returns a user input value as the result. User can choose what this value is.
The result is added to a list, and the Join list node concatenate into a list every result of the loop.
We’re done with the Dynamo part. Check my vids below to see how it operates live.
On the Revit side, my choice was to apply values in a parameter to elements that succeed the test. The result in Revit is a specific filter to check for the value and then apply an override to the elements.
All the best dear reader for the coming year.
A short post to showcase an AEC gem I had the chance to see 2 weeks ago: Barcelona’s Sagrada Familia. Lot of things to say. Pictures first! words to come!